Introduction
As AI demand drives more power‑hungry data centres, it’s worth asking: how much more work do we get per watt today than a decade ago? This post surveys perf/W trends across three layers:
- Server CPUs
- GPUs/accelerators
- Data‑centre infrastructure (power, cooling, interconnect)
TL;DR
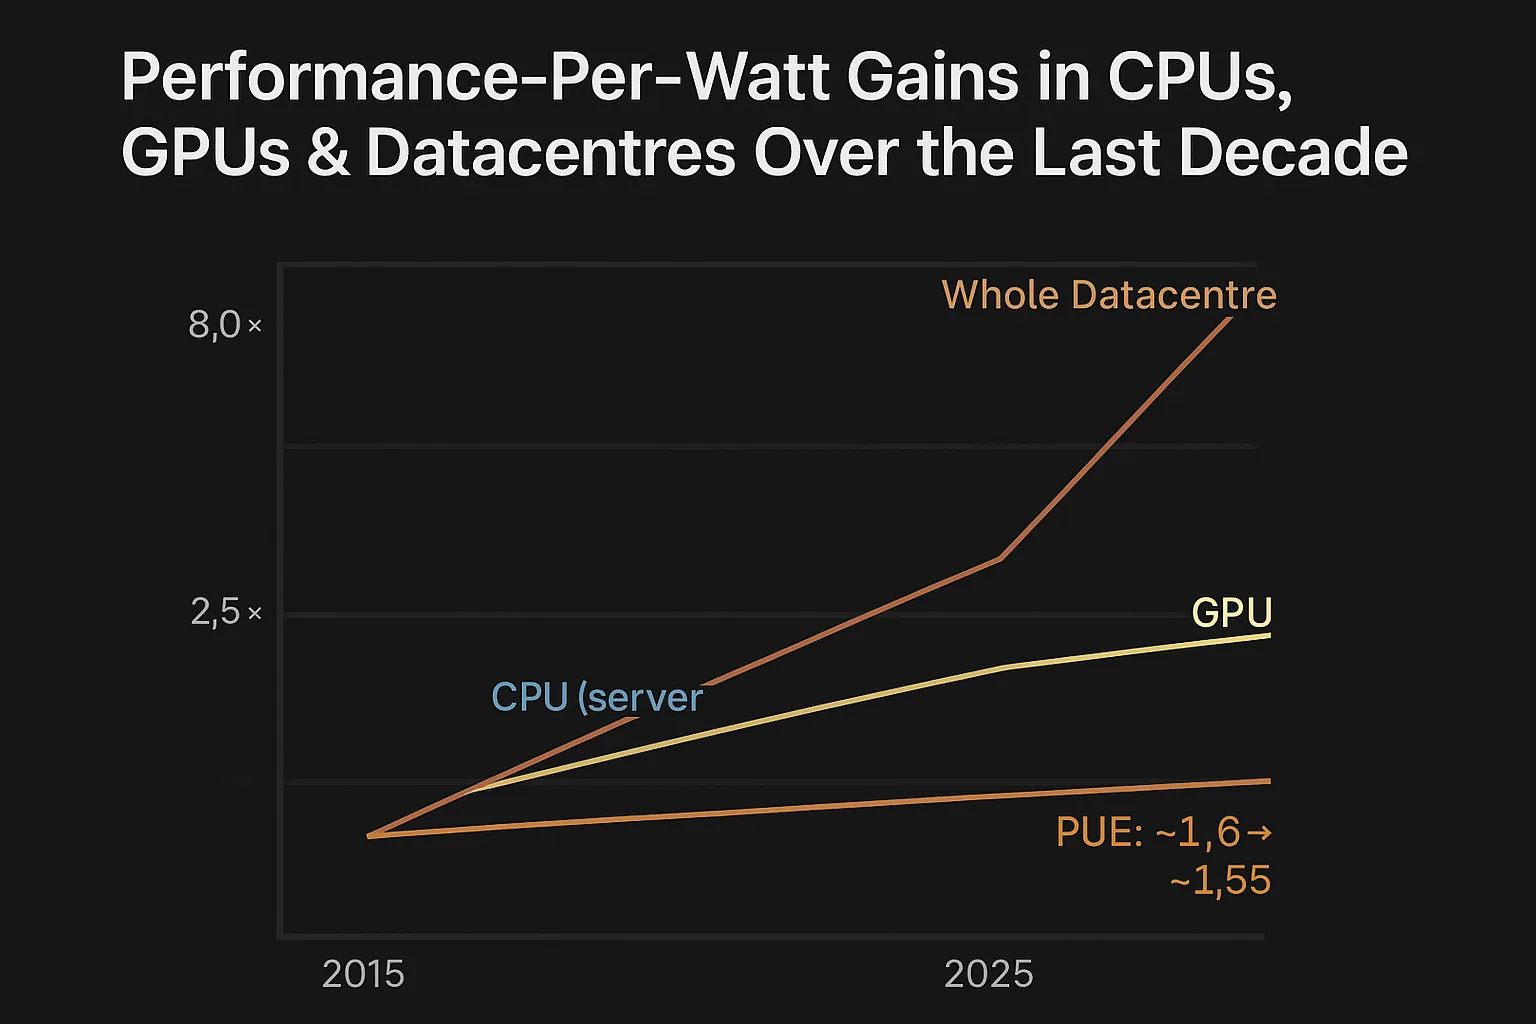
| Domain | ~10‑year improvement (perf/W) | Main drivers |
|---|---|---|
| Server CPUs | ~1.5×–3× | Process nodes, µarch, DVFS, core counts |
| GPUs/Accelerators | ~3×–>4× (esp. ML/inference) | Tensor/AI cores, low‑precision math, memory BW, specialized engines |
| Data centre (system) | ~5×–10× at the very top; infra gains slower | Chip gains + cooling/PSU/interconnect optimisations |
Bottom line: perf/W improves each year, but demand for compute is rising faster.
CPU efficiency: the slow, steady climb
What we mean by perf/W
For servers, think throughput per watt (FLOPS/W in scientific use). System‑level benchmarks like SPECpower_ssj2008 and SERT 2 measure a whole server under load, giving realistic efficiency numbers.
What the data say
- Improvements are modest but steady. A survey finds GPU energy efficiency roughly doubles every 3–4 years, while CPU efficiency improves more slowly. arXiv
- In desktop/consumer charts, CPU power draw rises while efficiency gains are incremental; perf doesn’t scale with power. GamersNexus
- Green500 (GFLOPS/W at system level): ~7 GFLOPS/W in 2015 to ~70+ GFLOPS/W by 2024. TOP500
Takeaways
- Expect roughly ~1.5×–3× CPU perf/W improvement over ~10 years, workload‑dependent.
- Limits: IPC/clock headroom, process shrinks, thermal ceilings, diminishing voltage returns.
- Practical wins: power delivery, DVFS, better idle states, and system‑level tuning.
GPU efficiency: step‑function gains
Why GPUs jump
Massive parallelism, dedicated tensor/AI cores, lower‑precision math, and memory/interconnect advances enable larger gains.
What the data say
- Leading GPUs/TPUs roughly double efficiency every ~2 years. Epoch AI
- Example: H100‑based “Henri” around ~65 GFLOPS/W. HPCwire
- Vendors show large inference perf/W jumps vs. CPU‑only baselines, especially with low precision.
Takeaways
- Over a decade, ~3×–4×+ improvements are common, especially for inference and low precision (FP16/INT8).
- Real gains depend on workload mix (FP64 vs. FP16/INT8), memory subsystem, and utilisation.
- Match accelerator to workload; mind memory bandwidth, interconnect, and precision support.
Data‑centre/system level: beyond the chip
Why it matters
Racks add power delivery, cooling (CRAC/CRAH, chillers, liquid), network/storage, and other overheads. Track PUE = facility power ÷ IT power; lower is better (ideal: 1.0).
What the data say
- Top Green500 systems reach ~70+ GFLOPS/W by 2024 (e.g., JEDI at 72.7). NVIDIA
- Industry reports suggest average PUE has plateaued around ~1.55–1.60 for many sites.
- Even if IT perf/W doubles, facility‑level gains are muted unless overheads drop too.
Takeaways
- Chip‑level perf/W is necessary but insufficient at rack scale; infrastructure design is decisive.
- As IT gets more efficient, the remaining 20–30% overhead becomes harder to shave.
- Plan with GFLOPS/W (or OPS/W) plus PUE and rack‑level metrics (power density, cooling headroom, modularity).
Closing thoughts
We’re getting more work per watt, but results vary by layer. CPUs deliver steady gains; GPUs post step‑changes, especially for ML. At data‑centre scale, the bottleneck is increasingly infrastructure. Net effect: efficiency rises, but demand rises faster.
